Bogong moth migration is contributing to radar echoes that resemble rain across parts of southeastern Australia, drawing fresh attention online. The equipment is detecting real objects, but interpreting those echoes requires care: the exact share caused by moths remains uncertain.
A weather map can look convincing even when the colours do not mean what a casual viewer expects. That is the puzzle behind the latest attention on Australian rain radars, where nighttime echoes have appeared over areas without corresponding rainfall. ABC meteorologist Tom Saunders reported the phenomenon on October 20, citing the Bureau of Meteorology and evidence linking much of the activity to migrating bogong moths. ABC’s report.
The story combines a recognisable daily habit—checking the rain—with a less visible natural event unfolding overhead. Its appeal does not require an invented view count or an extraordinary explanation. A real migration can produce an unexpected picture on a familiar screen. Understanding that picture requires separating the instrument’s detection from the meaning assigned to it.
What the recent reporting actually establishes
The Bureau confirmed increased non-precipitation echoes across eastern New South Wales. ABC reported similar activity on recent nights in northern and eastern Victoria. Timing after sunset, overlap with sightings and a widespread light-echo pattern all support the moth explanation. Crucially, ABC said the precise proportion of interference attributable to moths was unknown. That qualification rules out confidently labelling every coloured patch as insects. Evidence and uncertainty described by ABC.
The October 21 reports by The Daily Aus and Newcastle Weekly brought the explanation to additional audiences. These are follow-up accounts of the same developing public discussion, rather than evidence of a separate new equipment failure. The dates matter when the maps are reposted: a fresh social-media share does not necessarily show a fresh radar scan. The Daily Aus; Newcastle Weekly.
Radar sees returning signals, not labels
The Bureau’s radar guide explains that the instrument transmits radio waves and measures their return from objects. Rain, snow and hail can generate echoes, but so can insects, birds and other targets. That means a radar can be functioning correctly while its display contains signals that should not be interpreted as rainfall. The challenge lies partly in identifying and filtering what produced the return. Bureau radar guide.
This distinction is easy to lose in a screenshot. A coloured area is a visual representation produced from measurements and processing decisions. It is not a direct photograph of water reaching the ground. Calling the whole image “fake” would be misleading, because the detection may be real even when an assumed explanation is wrong.
The same Bureau guide identifies other interpretation problems, including rain evaporating before it reaches the ground and atmospheric conditions bending beams towards ground targets. Those possibilities explain why one convenient diagnosis cannot be applied to every unusual radar image. An apparent mismatch between a map and conditions outside the window calls for context, not an automatic conclusion that an instrument has stopped working.
Why different displays can tell different stories
The Bureau’s July 29 explanation of its weather maps distinguishes rain rate, reflectivity and estimated rainfall. Reflectivity represents returned signal strength; estimated rainfall can combine radar and rain-gauge information. The site also separates observations from forecasts. These products answer related but different questions, so they can differ without being mutually contradictory. Bureau guide to map layers.
For someone encountering a shared image, the first useful check is therefore the layer’s name. Is the display showing an observed signal, an estimate of accumulated rainfall, or the probability of future rain? The legend, timestamp and selected period often resolve more confusion than the colour pattern alone.
There is also a difference between rain aloft and rain at a particular location. A person standing in a dry garden has useful local information, but that observation does not establish what every target within a radar’s range represents. Equally, a nearby echo does not prove that measurable rain has fallen into that garden.
The migration behind the map
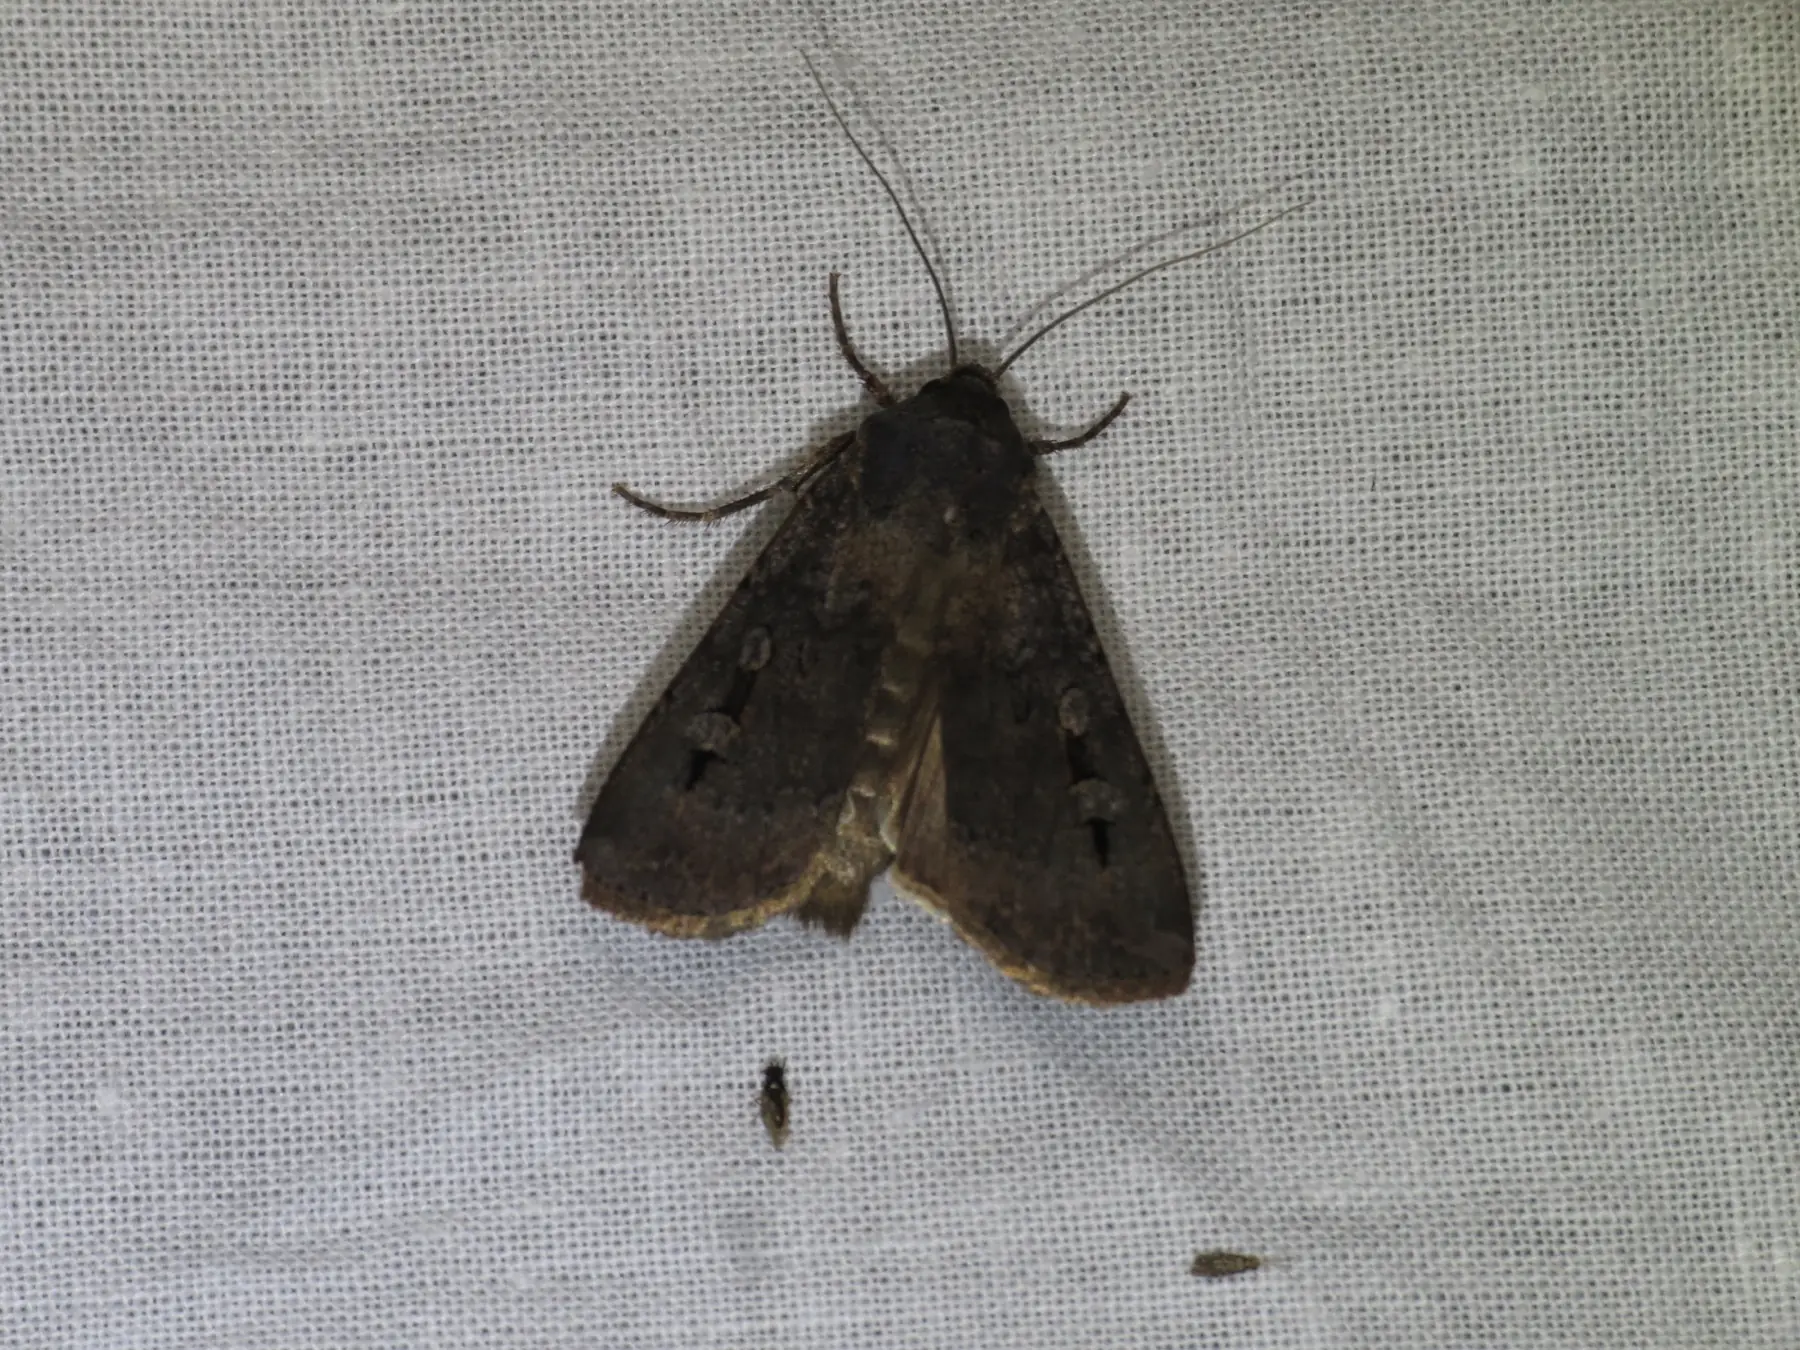
The Australian Museum identifies the bogong moth as Agrotis infusa and describes its mass spring movement through southeastern Australia. The species is a familiar migrant, with large numbers sometimes appearing around cities and outdoor venues. The present story concerns that biological movement becoming visible through an instrument normally associated with weather. Australian Museum species profile.
Zoos Victoria describes a spring journey of up to 1,000 kilometres towards the Australian Alps, followed by a return migration in autumn. Its explanation connects moth arrival with the seasonal needs of mountain pygmy-possums emerging from hibernation. The insects are therefore more than an inconvenience on a map: their movement forms part of an alpine food relationship. Zoos Victoria’s Moth Tracker.
A radar display nevertheless cannot, by itself, establish how successfully that journey is being completed. Visible activity over a city is evidence about activity in that location and time. It is not a direct measurement of arrival at alpine refuges, breeding success or the amount of food available to possums later in the season.
Why a conspicuous migration does not settle conservation concerns
Zoos Victoria lists bogong moths as endangered and describes pressures including drought, extreme weather, artificial light and habitat change. It also identifies mountain pygmy-possums as critically endangered. Those conservation concerns should not be dismissed simply because one night produces a visually impressive radar pattern. A concentrated movement and a secure long-term population are different things. Conservation context.
The opposite exaggeration should also be avoided. A photograph of moths at a light does not establish a catastrophic interruption to the entire migration. Claims about population recovery or decline need observations collected consistently across time and space. The most engaging image in a discussion is not automatically the most informative evidence about the whole species.
A remarkable navigator, studied before this week’s radar story
A separate strand of research makes the migration especially interesting. Lund University’s June 2025 account describes experiments showing that bogong moths can use the stars and Earth’s magnetic field for navigation. That work predates the present radar coverage and should not be presented as a discovery announced this October. Lund University’s research explanation.
The broader significance is the gap between the animal’s modest appearance and the journey it undertakes. Navigation research investigates how a small nocturnal insect maintains direction. Weather radar reveals a different aspect: enough airborne bodies moving together can create a detectable signal. These are complementary observations, not competing explanations of the same measurement.
Neither establishes that radar can read an individual moth’s destination or that every moth in a displayed area follows precisely the same route. Keeping the scales separate—individual orientation, collective movement and regional instrument coverage—makes the science more interesting and the reporting more accurate.
What citizen sightings can contribute
The Centre for eResearch and Digital Innovation describes the Bogong Moth Tracker as a way to gather observations about migration. Public sightings can help map where and when moths are noticed. Zoos Victoria invites photographs and says its team can check identification, which is useful when a member of the public is uncertain about the species. Tracker background; How sightings are verified.
Such contributions are valuable without being a complete census. A busy town may produce more reports because more people are looking. A quiet location may have fewer submissions even when insects pass through. Interpreting the observations requires remembering how the data were collected, rather than treating every gap on a public map as proof of absence.
For readers wishing to contribute, the useful observation is specific: a photograph, a date and a location submitted through the project’s own process. A forwarded screenshot with no source or timestamp is harder to interpret. Clear provenance helps both a scientist studying migration and a reader trying to understand a weather map.
A practical check for a surprising screenshot
Before sharing a radar image as evidence, keep the timestamp and legend in the frame. Identify the service and the selected layer, then compare the image with the relevant official observation or warning page. If the screenshot is an animation reduced to one frame, remember that the missing sequence may contain important information about when and how the signal appeared.
That process can preserve the fun of an unusual story while preventing a confident but unsupported claim. A light echo after dark may fit the reported moth pattern; it still does not identify every object detected. A caption that describes the evidence and its limit is more useful than a sweeping claim about broken forecasting technology.
For local decisions, follow current official warnings rather than treating an entertaining explanation of false echoes as permission to disregard a possible storm. Real rainfall and non-weather returns can occur within the same wider radar coverage. The existence of one does not automatically exclude the other, which is precisely why interpretation is necessary.
How to share the story accurately
An accurate description is that migrating moths are contributing to non-rain echoes in parts of southeastern Australia. It should preserve the uncertainty about the exact contribution and avoid claiming that all forecasts are unreliable. Weather services use multiple observations and forecasting methods; a misleading interpretation of one radar layer is not evidence that every forecast product has failed.
The same principle applies to our recent Orionid viewing guide: a real natural phenomenon becomes easier to understand when the conditions and limits of observation are explained. A dramatic picture benefits from a precise caption.
The current moth story is worth sharing because its verified explanation is unusual enough. An ordinary-looking insect undertaking a long seasonal journey can leave a signature on a national weather display. The right response is curiosity about what the instrument detected, supported by the Bureau’s explanation and the migration evidence, rather than confidence built from the colours alone.
Smashology Editorial Team
The Smashology Editorial Team is responsible for reviewing and publishing content at Smashology Media, overseeing sourcing, fact-checking, corrections, and editorial standards across coverage of internet culture, technology, entertainment, news, and crime.
Sources
Links cited in this article.
- Original sourcecommons.wikimedia.org
- reuse termscreativecommons.org
- ABC’s reportabc.net.au
- The Daily Austhedailyaus.com.au
- Newcastle Weeklynewcastleweekly.com.au
- Bureau radar guidebom.gov.au
- Bureau guide to map layersbom.gov.au
- Australian Museum species profileaustralian.museum
- Zoos Victoria’s Moth Trackerzoo.org.au
- Lund University’s research explanationlunduniversity.lu.se
- Tracker backgroundcerdi.edu.au