NASA has highlighted research suggesting Thwaites Glacier could contribute more to sea-level rise by 2100 than some earlier estimates. The revised model represents seawater melting ice across a broad grounding zone, improving its reconstruction of past retreat without predicting an imminent, complete collapse.
A small change in the model, a consequential change in the outlook
A newly highlighted NASA study puts the hidden boundary beneath Antarctica’s Thwaites Glacier at the centre of a difficult question: how much ice will reach the ocean before the end of this century? In an October 20 research announcement, the agency’s Jet Propulsion Laboratory said some simulations produced as much as twice the glacier’s contribution to sea-level rise projected by earlier estimates. The work involves a model developed with the University of California, Irvine, and Dartmouth College.
The timing deserves a clear distinction. NASA’s public announcement was issued on October 20; the peer-reviewed paper appeared in Nature Communications on October 12. This is coverage of that newly highlighted research, rather than a claim that scientists observed a sudden doubling of sea level overnight. A projection describes what a model produces under specified conditions. It is not a measurement of a future outcome already occurring.
The part of the glacier that a line cannot fully describe
Thwaites includes ice resting on the seabed and ice floating on seawater. The transition is often represented as a grounding line. But tides and seawater intrusion make that transition more complicated than a clean dividing mark on a map. JPL explains that representing a wider, actively melting grounding zone allows seawater’s influence beneath the glacier to enter the calculation more explicitly.
There is a useful physical distinction here. Drawing a boundary can describe where two regions meet, but it does not necessarily describe the area over which they interact. If water reaches inland beneath ice that a simplified model treats as firmly grounded, the model may omit a route through which heat affects that ice. The revision is about representing that interaction, rather than merely increasing a temperature setting until a larger loss appears.
Satellite observations helped establish the missing process
An earlier 2024 study by Eric Rignot and colleagues documented seawater intrusion beneath Thwaites using repeated radar observations from the ICEYE satellite constellation. Its observations, collected during March–June 2023, showed a grounding zone affected by tides rather than a permanently fixed transition between grounded and floating ice. The researchers identified kilometre-scale water intrusion as an important process for understanding why observed changes could outpace simplified model behaviour.
That earlier work is observational context, not the publication being announced this week. It helps explain the path from detecting a physical process to representing it in a model. Observations identify something the glacier is doing; modelling tests how including that behaviour changes a reconstruction or a projection. The two kinds of evidence support each other, but they are not interchangeable.
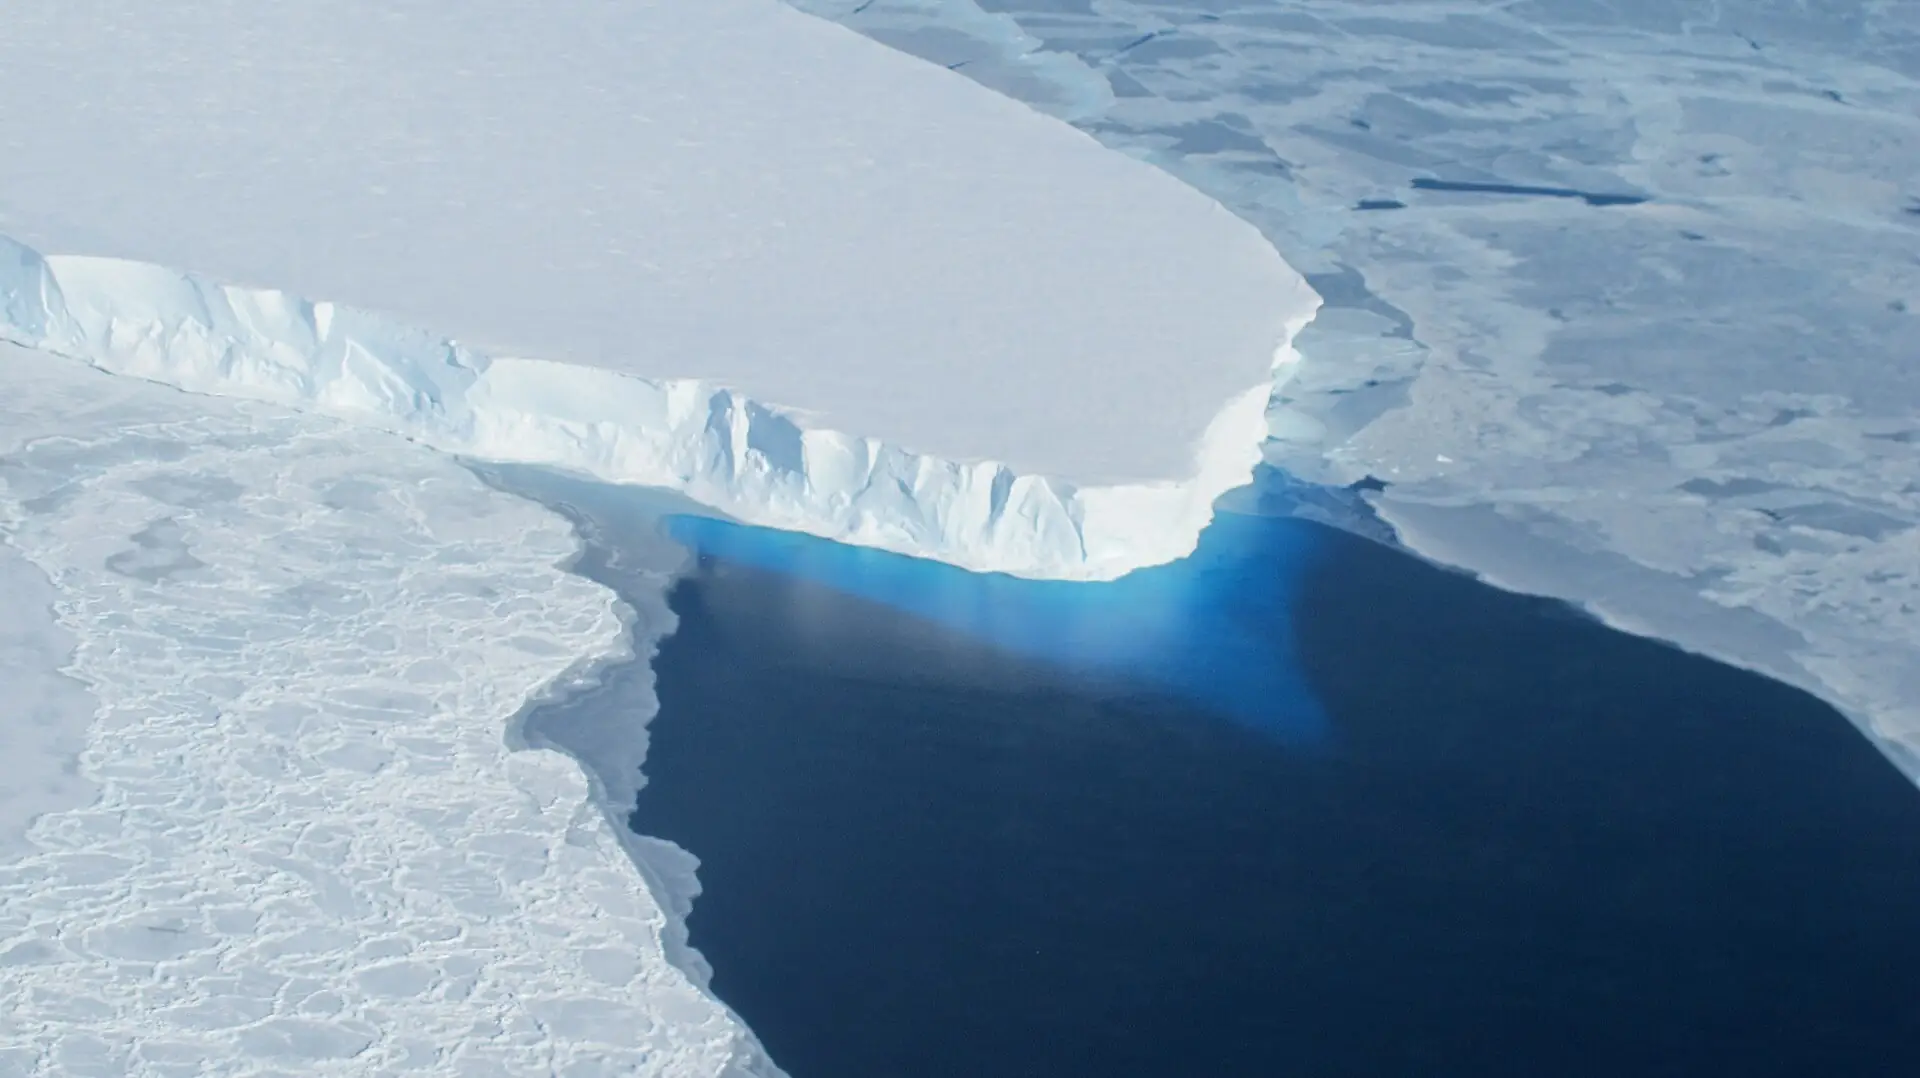
Radar observations are especially valuable in a place where the relevant boundary is hidden beneath ice. A surface photograph can show the glacier’s form and its interaction with the sea, but it cannot by itself reveal the full reach of water below grounded ice. That is why the striking aerial image accompanying this article is an illustration of the actual glacier, not visual proof of a particular model result.
What the new projection says
The Nature Communications paper by Mattia Poinelli and colleagues reports up to 30 ± 6 millimetres of global mean sea-level contribution by 2100 under its constant-climate baseline. Thirty millimetres is three centimetres, or about 1.2 inches. The baseline isolates grounding-zone effects without adding further climate warming. It should not be interpreted as a prediction that the real climate will remain unchanged.
The comparison is with previous projections for Thwaites under the relevant modelling conditions. It does not mean the study doubled the projected contribution of every glacier, doubled all Antarctic ice loss or doubled the world’s total sea-level forecast. Those would be different calculations involving other ice masses, ocean warming and additional processes.
The number also needs its time horizon. Three centimetres accumulated by 2100 is different from three centimetres added in one year. A study can revise a glacier’s contribution upward without predicting a single dramatic event that delivers the entire amount at once. Keeping the unit, source and period together makes the result easier to interpret accurately.
Why land-based ice and floating ice have different roles
NASA’s explanation of glacial ice loss describes why the grounding boundary matters for sea level. Floating ice already displaces seawater, while the transfer of previously grounded ice into the ocean adds to the sea-level budget. Floating shelves can nevertheless influence the rate of that transfer by resisting the flow of ice behind them. Their importance is not captured simply by asking whether melting the floating portion directly raises the water.
The same NASA explanation describes how underwater terrain affects the response. In parts of West Antarctica, the bed deepens inland. Retreat can expose thicker ice to the ocean and alter the resistance holding the glacier back. The shape of the bed, the movement of water and the flow of ice therefore belong in the same physical story.
That does not make every retreat self-evidently unstoppable on a fixed schedule. Ridges, local geometry and changing conditions matter. The challenge is to determine which features slow the system, which processes weaken that resistance and how they interact through time. A model that ignores a relevant interaction may reproduce one aspect of a glacier while missing another.
A better account of the past strengthens a projection
According to JPL’s announcement, adding grounding zones improved the model’s ability to reproduce historical satellite observations extending back into the 1990s. That is an important test because a projection is more informative when its physical representation can also account for measured changes. The result is not simply a larger future number; it is a revised account of how the glacier has already evolved.
Reconstructing history and predicting the future remain different tasks. A model may fit the available record yet face conditions outside that record later. The most useful question is therefore not whether one successful reconstruction proves the entire forecast, but whether the added process has observational support and whether remaining assumptions are made explicit.
The paper identifies limitations including its fixed effective grounding-zone length and the absence of fully coupled ice–ocean behaviour. These leave room for further work on changing geometry and water circulation. Acknowledging them does not cancel the finding. It describes the boundary between what the experiment tested and what a more complete representation would need to address.
The total ice reservoir is a different number
The International Thwaites Glacier Collaboration’s facts page estimates that complete loss of Thwaites would correspond to about 65 centimetres of global sea-level rise. That describes the glacier’s full potential contribution, not the amount the new study projects for this century. Substituting the larger reservoir figure for the model’s 2100 result would give readers a misleading impression of both magnitude and timing.
The collaboration’s September 2025 findings summary similarly distinguishes continuing retreat from an immediate full collapse. It describes a rapidly changing system and a need to improve knowledge of the processes controlling future loss. That dated synthesis provides context; it is not a new announcement issued alongside the October 2026 paper.
These distinctions explain why the familiar “Doomsday Glacier” nickname is an inadequate summary. It conveys concern but says little about a mechanism, probability or time horizon. The scientific question is more useful and more precise: how much will be lost, how fast, under which conditions, and with what uncertainty?
Why a global average is not a local flood map
NOAA explains that local relative sea level can differ from the global average because land can rise or sink, ocean currents vary and other regional processes affect water height. Tide gauges measure water relative to a location on land, while satellite observations help describe changes across the ocean. A global contribution from an Antarctic glacier is therefore one ingredient in a local assessment, not a ready-made forecast for every harbour.
For a coastal authority, the useful next step is to combine relevant sea-level projections with local elevation, land movement and flooding information. A single glacier result cannot identify which road will flood on a particular day. Nor can it establish a universal threshold at which a seawall becomes inadequate. Those questions need location-specific evidence.
The research still matters to planning. Infrastructure decisions extend over decades, and uncertainty about future water levels is one reason to examine a range of outcomes. A revised contribution from one ice source can inform those assessments without being converted into an unsupported claim that every coastal community faces the same additional flood depth.
What further evidence would improve the picture?
The collaboration’s findings emphasise sustained observations, including measurements of ocean conditions and the glacier bed. These can test whether a model’s assumptions remain appropriate as the system changes. Satellites provide broad coverage; measurements near and beneath the ice can address processes that broad coverage alone cannot resolve.
The immediate significance of the October 20 announcement is that a physically important part of the glacier–ocean boundary changes the modelled outlook. It gives researchers a clearer process to test and coastal planners another reason to examine Antarctic uncertainty carefully. It supports concern about future ice loss while preserving the essential distinction between a higher projection and a claim of imminent, complete collapse.
Related climate research: how scientists assessed climate change and El Niño in Hurricane Polo.
Smashology Editorial Team
The Smashology Editorial Team is responsible for reviewing and publishing content at Smashology Media, overseeing sourcing, fact-checking, corrections, and editorial standards across coverage of internet culture, technology, entertainment, news, and crime.
Sources
Links cited in this article.
- NASA/JPL’s October 20, 2026 research reportjpl.nasa.gov
- JPL image-use policyjpl.nasa.gov
- 2024 study by Eric Rignot and colleaguesescholarship.org
- Nature Communications paper by Mattia Poinelli and colleaguesnature.com
- explanation of glacial ice lossnasa.gov
- International Thwaites Glacier Collaboration’s facts pagethwaitesglacier.org
- September 2025 findings summarythwaitesglacier.org
- NOAA explainsoceanservice.noaa.gov